Remote sensing analysis software for Earth sciences
EXAMPLES GAL
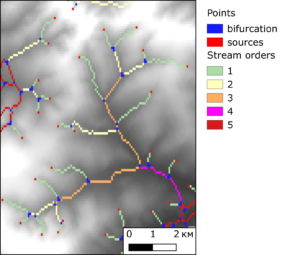
Erosion network detected with ENOE softwareComparison between linear elements map (left) and their density map (right).Linear elements density zoning as result of the earthquake event (Western Sakhalin)Rose histogram plot output as visualization of lineaments directional statisticsLinear elements, faults and density map produced by program for the sample image and composed in QGIS